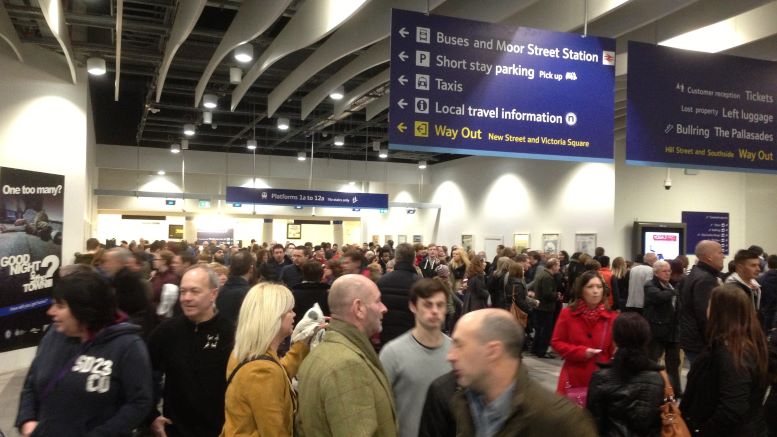
Waterloo has retained its place as the busiest station in Britain as the Office of Rail and Road has published its station usage figures for 2018/19.
Ranked by the total number of passenger entries and exits, Waterloo recorded 94.2 million users in the year from 1 April 2018 to 31 March 2019.

Behind Waterloo in the rankings were London Victoria (74.7 million), London Liverpool Street (69.5 million) and London Bridge (61.3 million).
Up to fifth, and the only non-London station in the top 10, came Birmingham New Street with 47.9 million entries and exits.
This pushed London Euston down to sixth with 46.1 million, followed by London Stratford (41.2 million), London Paddington (38.2 million) and London St Pancras International (36.0 million) with London Kings Cross (34.6 million) rounding out the top ten.
Further afield, Glasgow Central was 11th, Edinburgh Waverly 18th and Cardiff Central 34th.

At the other end of the spectrum, 54 stations recorded fewer than 1,000 entries and exits in the full year. The least used stations were Denton (Greater Manchester) and Stanlow & Thornton (Cheshire), each only having an estimated 46 entries and exits during the entire year, while Reddish South (Stockport) had just 60.
In contrast, the two new stations that opened in 2918/19 fared much better. Kenilworth opened on 30 April 2018 and attracted 170,912 users in 11 months while Maghull North on Merseyside, which didn’t open until 18 June 2018, recorded 399,066 entries and exits.

The full list can be found on the Office of Rail and Road (ORR) website. Meanwhile here is the Top 50:
| Station | Entries & Exits 2018/19 |
|
|---|---|---|
| 1 | London Waterloo | 94.2 million |
| 2 | London Victoria | 74.7 million |
| 3 | London Liverpool Street | 69.5 million |
| 4 | London Bridge | 61.3 million |
| 5 | Birmingham New Street | 47.9 million |
| 6 | London Euston | 46.1 million |
| 7 | Stratford (London) | 41.2 million |
| 8 | London Paddington | 38.2 million |
| 9 | London St Pancras International | 36.0 million |
| 10 | London Kings Cross | 34.6 million |
| 11 | Glasgow Central | 32.8 million |
| 12 | Leeds | 30.8 million |
| 13 | Highbury & Islington | 30.4 million |
| 14 | Manchester Piccadilly | 30.3 million |
| 15 | London Charing Cross | 30.2 million |
| 16 | Clapham Junction | 29.5 million |
| 17 | East Croydon | 24.8 million |
| 18 | Edinburgh | 23.9 million |
| 19 | Canada Water | 23.7 million |
| 20 | Gatwick Airport | 21.2 million |
| 21 | Vauxhall | 21.0 million |
| 22 | London Cannon Street | 20.6 million |
| 23 | London Fenchurch Street | 18.5 million |
| 24 | Wimbledon | 18.5 million |
| 25 | Brighton | 17.4 million |
| 26 | Glasgow Queen Street | 17.2 million |
| 27 | Reading | 17.1 million |
| 28 | London Marylebone | 16.1 million |
| 29 | Farringdon | 15.1 million |
| 30 | Liverpool Central | 14.6 million |
| 31 | Barking | 14.5 million |
| 32 | Whitechapel | 14.4 million |
| 33 | Liverpool Lime Street | 14.2 million |
| 34 | Cardiff Central | 14.2 million |
| 35 | London Blackfriars | 12.1 million |
| 36 | Cambridge | 12.0 million |
| 37 | Richmond (London) | 11.7 million |
| 38 | Moorgate | 11.5 million |
| 39 | Bristol Temple Meads | 11.4 million |
| 40 | West Ham | 10.7 million |
| 41 | London Waterloo East | 10.5 million |
| 42 | Lewisham | 10.3 million |
| 43 | York | 10.0 million |
| 44 | Sheffield | 9.9 million |
| 45 | Stansted Airport | 9.8 million |
| 46 | Shoreditch High Street | 9.4 million |
| 47 | Manchester Oxford Road | 9.3 million |
| 48 | Surbiton | 9.3 million |
| 49 | Romford | 9.2 million |
| 50 | Manchester Victoria | 8.9 million |


Be the first to comment